Sales
Boothy
Boothy turns artists' handwritten market-sales notes into structured transactions and dashboards so they can understand what sold, how much they made, and what to bring to future events. The workflow combines vision-based extraction with human review, source-line tracing, confidence scores, and dashboard updates after import. The product is positioned not as one-off OCR, but as a reusable data pipeline for indie artist commerce.
The problem
Independent artists who sell at art markets and farmers markets rarely have time to log sales in an app mid-event. Most just write them down on a sheet of paper — product name and price — then face a manual, time-consuming slog to get that into any tool. On top of that, sales scatter across cash, Venmo, and marketplaces like Poshmark, Etsy, and Depop, some without public APIs. Platforms like Shopify or Square only capture transactions run through their own software, so the artist never really knows how much they sold of a given product, size, or at which event — leaving inventory and production decisions to guesswork.
The solution
Boothy turns a photo of handwritten market-sales notes into structured transactions and dashboards, so artists can see what sold, how much they made, and what to bring next time. It's positioned not as one-off OCR but as a reusable data pipeline for indie artist commerce. The artist defines a catalog, snaps a photo of their pen-and-paper record, and Boothy extracts each item, quantity, and price into an editable review table before anything is saved. Corrections feed back into the model over time (human-in-the-loop). A second flow lets users ask for a custom report in plain text and see a new chart appear on the dashboard.
How it works
The core is a single vision call feeding a dashboard. The user enters event name and dates, uploads one or more images, and the model extracts rows for a review table where every cell is editable before import. Extraction runs on Claude with data stored in Supabase. Prompt iteration hardened the hardest cases: explicit rules for bundled transactions (splitting "Poch Waves $44" into separate priced items instead of assigning the full amount to the first), plus confidence scoring, review notes, source-line tracing, and an estimate of visible transactions to flag potential missing rows. Count matters as much as accuracy — a missed row is invisible if you only check what came back. Extraction accuracy climbed from a 72% average toward 90%, with user corrections forming a growing ground-truth set.
Who it's for
This is a B2B product for small, local artists who sell homemade goods in person at art and farmers markets and online. The ideal customer sells across multiple channels and needs an aggregation tool for insight into their sales. Higher-value users need more integrations — Depop, Shopify, Square — and a higher subscription tier. Their goals are to maximize sales by understanding top channels, events, product lines, and sizes, and to optimize inventory by producing more of what sells. Boothy launches in the Honolulu and Bay Area markets, where the team already has connections.
Why it matters
The arts and crafts market sat at $45.26B in 2023, projected to reach $63.21B by 2029, with demand for non-AI art resurging in protest to AI-generated work. Boothy runs a $10/month subscription with a 14-day free trial, where trust and apparent value are imperative and word of mouth carries the early going. The plan starts with a pilot of artists who currently track sales by hand, testing against real handwriting styles before broader release. Value is measured through successful imports, retention, repeat uploads, time saved, and trial-to-paid conversion — with a continuous loop where production feedback keeps improving extraction quality.
The workflow
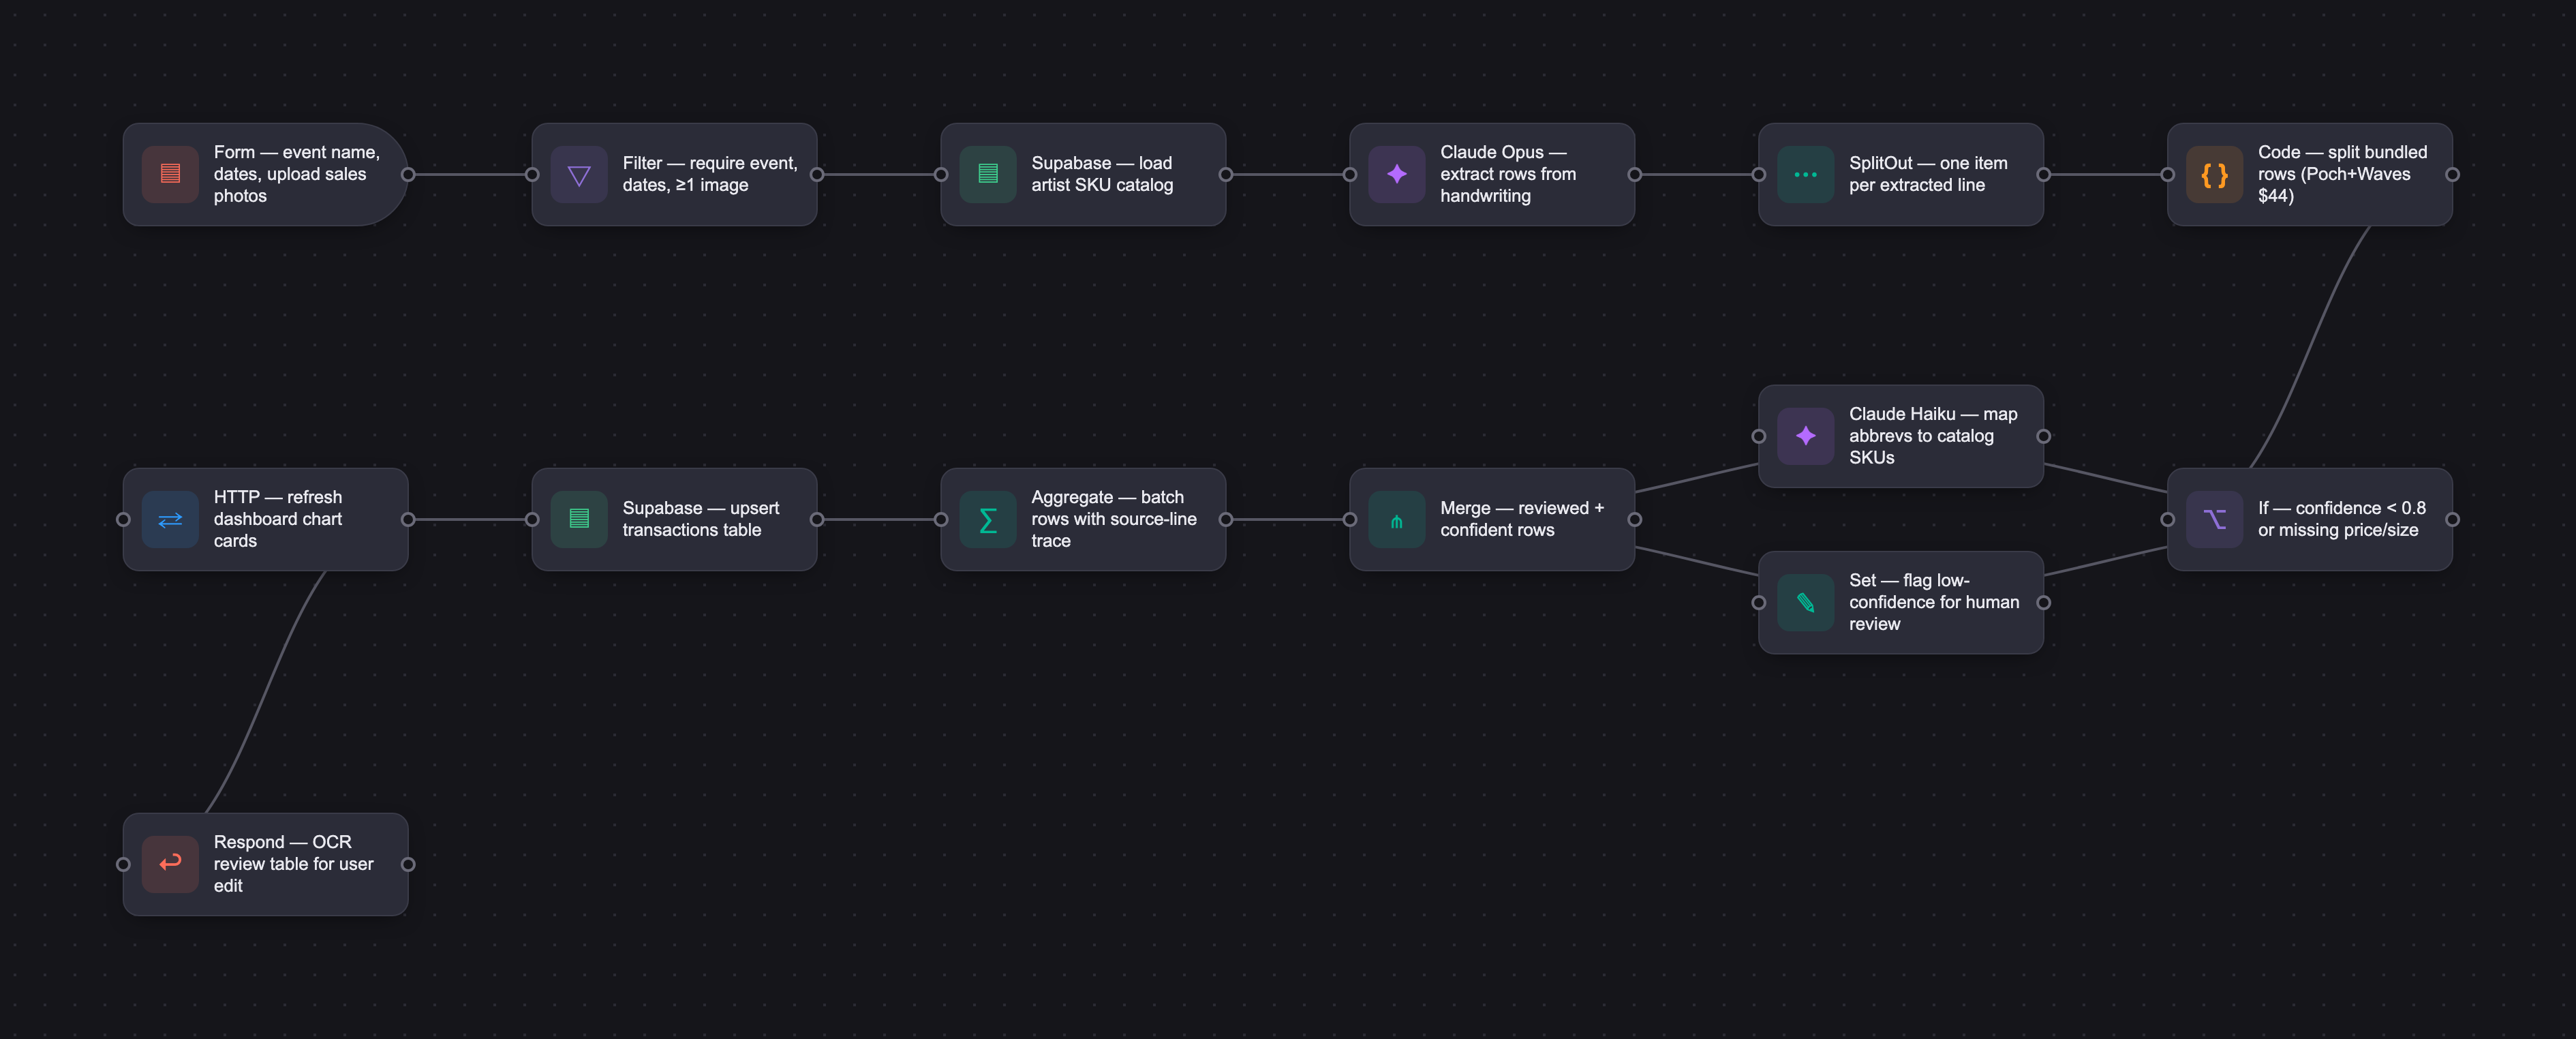
The PRD
| PRODUCT FACULTY — AI PRODUCT REQUIREMENTS DOCUMENT (PRD) Version 1.0 | ||||||
|---|---|---|---|---|---|---|
| Your Name: | Michael Keller | |||||
| Your Product: | "Boothy" the sales intelligence platform for indie art vendors | |||||
| Your Industry: | Local art vendors who sell homemade art products online or at in-person art or farmers markets | |||||
| Date: | May 6, 2026 | |||||
| 4D Method | AI PRD | Instructor Feedback | ||||
| Phase | Activity | Theme | Topic | Key Question(s) | Your Response Include external links to visuals/prototypes as required. | |
| DISCOVERY | Understand your market, business, product & user context | Business Value Map | Market Attractiveness | What industry is your business in? (ie Financial services, Healthcare, Education, etc)? | Local art vendors who sell homemade art products online or at in-person art or farmers markets | Please leave this area blank. This space is for the Instructor to provide you with feedback. |
| What are the key challenges (headwinds) and opportunities (tailwinds) impacting growth in your industry? Who are the key competitors? | • Challenges: Low reach (relies on social media channels, in-person presence at local art events, online sales channels like Poshmark or Etsy). Low barrier to entry, so many artists selling similar products which makes it difficult to differentiate. Generative AI and 3D printers saturating the art space, creating lower demand for artists to sell their homemade work. • Opportunities: Demand for non-AI art is resurging in protest to AI generated art. It's increasingly easy to expand your online presence as an artist through social media and marketplaces like Poshmark and Etsy through boosting, AI-assisted design tools like Figma and LLMs for copywriting increasing throughput of artists who want to post about their art and find new customers. In a post-pandemic world, more artist markets are opening in major cities. • Competitors: Shopify, Square, FigmaMake, ArtLogic | |||||
| What is the projected growth rate of your target market segment over the next 3-5 years? | Art and crafts markets sat at a $45.26B market size in 2023, projected to grow to $63.21B by 2029 according to researchandmarkets.com. | |||||
| Business Model | What growth stage is your business currently in (e.g., startup, scale-up, mature)? | Startup (hasn't been built yet) | ||||
| How does your business make money? What do they sell? What is your primary revenue model (e.g., subscription, freemium, licensing, marketplace, transactional, etc?) | Subscription model. $10/month with a 14-day free trial. Artists will have a high threshold for paying for a platform like this, so the value must be apparent and trust in the market will be imperative. Word of mouth will go a long way to start. Will start in the Honolulu and Bay Area markets, as we have footholds and connections there already | |||||
| Who is your primary customer base (B2B, B2C, B2B2C)? | B2B | |||||
| Differentiators | What are the key differentiators for your company? | Platforms like Shopify or Square depend on transactions happening through their software apps or hardware terminals. But these miss sales made through channels like cash, Venmo, websites like Poshmark without publicly available APIs. This creates a piecemeal output, where the artist never knows exactly how much he/she has sold of a given product, size of a product, or at which event he/she sold them at unless he/she manually records everything by hand or in a notetaking app like Notion. | ||||
| Feature Value Map (IMPORTANT NOTE: This section is only relevant if you are working on enhancing an existing product. It does not apply if you are developing a new product from 0 to 1.) | Customers | Who are the customers (ie buyers) of your product? | Small, local artists who sell their homemade art or crafted goods in-person at art and farmers markets, or online via social media channels or platforms like Poshmark and Etsy. ICP is an artist who sells across multiple channels and needs an aggregation tool which provides insights into their sales | |||
| End Users | Who are the end-users of your product? Which users are the most revenue-generating / revenue-impacting for your company? What are their goals, roles, and context? | • End-Users: The small, local artists who want to track their sales across different channels. • High Revenue Users: Ones who need a higher subscription tier, i.e. ones who require more integrations with 3rd party applications like Depop, Shopify, or Square • Goals: Maximize sales by understanding their top channels (online vs in-person), events (i.e. which types of markets or online platforms generate the most revenue), product lines (i.e. homemade clothing, art prints, stickers, stuffed animals), and sizes (i.e. large vs small tank top). Also, to optimize inventory by producing more of what sells for upcoming events and campaigns | ||||
| Current Products / Services | If you are a Product-led business: What are the core features of your product, and how do they address user needs? If you are a Service-led business: What are the key services you offer to customers? | Product-Led Business: • Visual dashboard representing sales with filters for time period, channel, product line • Integrations with 3rd party platforms where users sell online like Etsy, Depop, Ebay • Integrations with 3rd party payment collection platforms like Square, Shopify, Venmo • Take a photo of sales written down via pen & paper and load those into the dashboard as manual charges, if sales were tracked by pen & paper at an in-person art market but transactions were paid via cash or virtual payment like Venmo | ||||
| User Value Map | Target Persona | Who is your AI product / feature for? (Internal users, external users, an influencer, a buyer, etc) | • Internal-Users: The small, local artists who want to track their sales across different channels. • High Revenue Users: Ones who need a higher subscription tier, i.e. ones who require more integrations with 3rd party applications like Depop, Shopify, or Square • Goals: Maximize sales by understanding their top channels (online vs in-person), events (i.e. which types of markets or online platforms generate the most revenue), product lines (i.e. homemade clothing, art prints, stickers, stuffed animals), and sizes (i.e. large vs small tank top). Also, to optimize inventory by producing more of what sells for upcoming events and campaigns | |||
| Journey Map (current-state) | What is the typical journey for your target persona when they are using your product / service, focusing on their ideal experience (happy path) as they interact with your product? | When my ICP is preparing for an art event, ideating new product lines, or reviering their finances, they can easily open the dashboard and filter down to find the revenue data they're looking for. Similar to any other data visualization platform. The dashboard will not be customizable to start, but could be extended to allow the user to create custom reports. When my ICP is finishing an art event where they wrote down sales on a piece of paper (very common for artists at art markets), they can take a. photo of the paper, open the app, upload it, LLM reads it, logs them as manual transactions which asks them which event it was and how payment was collected (i.e. cash, Venmo). | ||||
| Pain-points | Where does the user experience friction, obstacles, or unmet needs throughout the journey? Identify which pain-points are most frequent and severe? | • Pen & Paper Records: During an art event, don't have time to record your sales in an app. Most artists just write them down on a sheet of paper with the name of the product and how much they sold it for. But loading that into a tool to aggregate and visualize their sales is very manual and time-consuming • Analyzing Sales Cross-Channel: Tracking how much they've sold across in-person and online channels can be frustrating and confusing, so they never know exactly how much they've made in a given week, month, or year • Inventory and Production: When producing more art to sell (i.e. printing more prints, making more clothing), it can be confusing what they should produce. For example, which items typically sell well at events like this? Which sizes of clothing? Which size of art prints? So you're operating in the dark and guessing what to produce | ||||
| AI Opportunities | From your list of pain points, identify those that can effectively be addressed using Generative AI. Remember, this project focuses on leveraging LLM-powered AI to solve your target persona's pain points. Rank these pain points starting with the most severe and frequently occurring first. | 1. Pen & Paper Records: Upload a photo of what you wrote down via pen and paper, then LLM analyzes that photo and creates records for each individual sale with which item was sold, metadata for that sale (i.e. product line, size), the amount it was sold for, and payment method (i.e. cash, Venmo) 2. Inventory and Production: Easily analyze your sales from similar events using dashboard filters. This is more of a simple product feature than one driven by AI. 3. Analyzing Sales Cross-Channel: By aggregating sales data via 3rd party integrations and manual uploads, you gain an all-in-one view of your sales and revenue. Similar to a budgeting app like Rocket Money or Emma. LLM useful for manually uploaded records, and for 3rd party apps without publicly available APIs | ||||
| Develop an AI Solution Hypothesis | AI Solution Hypothesis | Diverge | Ideate potential solutions to address your AI-solvable pain points. Focus on generating a high quantity of ideas rather than evaluating their quality at this stage. | • Upload photo, analyze photo contents, load as manual transactions • Take photo of sales from 3rd party tools which don't have publicly available APIs and upload them to your dashboard easily as manual transactions • Ask the dashboard questions via LLM chat or voice-to-text and get custom reports based on your query • Auto-categorize transactions by predicting from previous transactions (i.e. this looks like a new shirt product line) • Auto-detect HEX codes and products from photos of your art work to personalize the dashboard UI | ||
| Converge | Rank your ideated solutions based on impact and feasibility. Identify your top three AI solutions, and clearly select the one you'll focus on for your project. | 1. Upload photo, analyze photo contents, load as manual transactions (pipeline - one vision call feeding a dashboard). When a user corrects the manual transactions, that feeds back into the AI model, feed that back into the model to make it more performant and accurate (human-in-the-loop) 2. Take photo of sales from 3rd party tools which don't have publicly available APIs and upload them to your dashboard easily as manual transactions 3. Auto-categorize transactions by predicting from previous transactions (i.e. this looks like a new shirt product line) | ||||
| DESIGN | Define Target State Workflow | UX Flows & Wireframes Suggested Tool: Excalidraw | Workflow (future) | Assuming your product or feature works as desired, what is the target state workflow? | 1. User manually defines their catelog in the product 2. User takes photo of transactions written on pen and paper 3. Agent reads photo captures each item sold, quantity, price, SKU 4. Agent loads transactions into DB table 5. Agent visualizes transactions in chart on dashboard 6. When a user corrects the manual transactions, that feeds back into the AI model, feed that back into the model to make it more performant and accurate (human-in-the-loop) | Please leave this area blank. This space is for the Instructor to provide you with feedback. |
| Build Wireframes | Wireframes | How will users navigate through your AI solution? What are the key steps and decision points? What information will be displayed at each stage? What specific UI elements are needed on each screen? How will the layout accommodate AI features? | 1. Define product catelog (SKUs) 2. Integrate with 3rd party channels like Depop 3. Upload photos of manual transactions 4. View dashboard with all sales, which includes reports of sales by SKU, by event, by time period. Dashboard also includes filters to drill down into reports on dashboard. There is a UI component for uploading manual transactions, which will use AI to scan the pen and paper record and load those into a report through a multi-step agentic workflow | |||
| Develop Prototype to showcase AI interactions | Prototype Screens Suggested Tool: lovable.dev | What aspects of the AI solution will you demonstrate in your prototype? How will the AI inputs, processing, and outputs be presented visually to users? Which features are essential for launch? What can be left for later releases? | https://lovable.dev/projects/eb90b678-bccd-4d9c-881a-dff009d1bb7e?magic_link=mc_cddfbffe-c4ec-48dc-8e30-ffe0b6c03b19 In my prototype, I'll demonstrate two core AI-driven flows. 1. Upload a photo of manually recorded transactions from a market and log those in a table which fuels the data visualizations. This is a pipeline (one vision call feeding a dashboard). 2. Ask the LLM to create a custom report on the dashboard based on text-based input. | |||
| Initial Prompt Design | Master Prompt [Initial Design] | Create an initial master prompt. Consider the following: What tone or personality should the AI use? How should user input and system instructions be structured for maximum clarity? What system instruction will govern the AI's behavior? What examples might improve performance? How will you format outputs for consistency? | Design a modern, polished web app prototype for independent artists and creators who sell products at local art events and online marketplaces. The product is a browser-based SaaS dashboard for tracking sales across in-person art events and online stores like Etsy, Ebay, and Depop. The design aesthetic should feel: modern but cozy creative and artist-friendly inspired by tools like Linear, Notion, and Stripe dashboards slightly playful with subtle illustrations optimized for desktop first clean whitespace rounded cards soft shadows highly visual data dashboards elegant empty states dark mode support responsive layouts Use realistic fake data throughout the prototype. The app has 5 primary experiences: Login Dashboard Transactions Integrations Settings The product name should be “Boothbook”. GLOBAL LAYOUT Use a left sidebar navigation with: Dashboard Transactions Integrations Settings Top header should include: page title search bar notification bell uploaded user logo/avatar on upper right Use a modern SaaS layout with card-based analytics. Use tasteful pastel accents inspired by convention artist alley aesthetics: lavender muted pink cream soft blue mint Typography should feel premium and modern. LOGIN EXPERIENCE Create a beautiful login screen. Include: product logo tagline: “Track every art sale — from artist alley to Etsy.” login form email field password field “Continue with Google” SSO button Login CTA Sign Up CTA Background should include subtle illustrations of: stickers keychains shirts prints artist booth setups After login, transition to Dashboard. DASHBOARD PAGE This is the home screen after login. If NO transactions exist: Show a polished empty state. The empty state should include: illustration of a fictional sales report fake event named: “My First Art Event” sample bar chart displaying shirt sales Fake SKUs: Moomin Shirt Pochaco Shirt Keroppi Shirt Angel Feire Shirt Hamtaro Shirt Include a text link: “Add art sales here” The link should visually route users to the Transactions page. If transactions DO exist: Show analytics dashboards instead. Include these chart cards: Cumulative Sales — Last 12 Months line chart X axis = month Y axis = revenue Sales by Product Category vertical bar chart categories: shirts prints stickers keychains jewelry Sales by Product Subcategory horizontal bar chart examples: Moomin Pochaco Hamtaro Keroppi Sales by Event stacked bar chart event names on X axis KPI cards at top: Total Revenue Top Selling Product Best Event Average Order Value Use highly polished data visualizations similar to Stripe or Framer analytics dashboards. TRANSACTIONS PAGE This page behaves like a lightweight relational database. At the top left: Two primary CTA buttons: New Event New One-Off Sales Below: A large editable data table. Columns: Date(s) Event Name Product Category Product Subcategory Price Payment Method Payment methods include: Cash Venmo Square Paypal Each row represents ONE individual item sold. Use realistic fake rows from anime convention artist alleys. Example rows: 05/14/2026 | Kawaii Expo | Shirts | Pochaco | $32 | Venmo 05/14/2026 | Kawaii Expo | Prints | Moomin | $15 | Cash 05/15/2026 | Sakura Market | Stickers | Keroppi | $8 | Square Table should support: sorting filtering searching inline editing pagination sticky headers NEW EVENT MODAL FLOW When user clicks “New Event”, open a multi-step modal. STEP 1 — EVENT DETAILS Modal should include: Event Name text field Date selector button labeled “Date(s)” When clicked: Open embedded mini calendar overlay inside modal. Support: single date selection multi-day continuous ranges “Continue” button is disabled until: event name entered dates selected STEP 2 — IMAGE UPLOAD Show image uploader UI. Text: “Upload photos of your handwritten sales notes.” Include: drag/drop upload area Upload button Allow: one or multiple images After upload: Show animated processing sequence. Sequence: “Good job!” — 2 seconds “Scanning your sales...” — 3 seconds “Uploading the good stuff...” — 2 seconds “Success!” — 2 seconds Use delightful animated loading illustrations. STEP 3 — OCR REVIEW TABLE Show editable extracted transaction table. Columns: Product Category Product Subcategory Price Populate with fake OCR results extracted from handwritten notes. Example: Shirts | Pochaco | $32 Prints | Moomin | $15 Stickers | Hamtaro | $6 Users can: click cells edit values delete rows add rows Primary CTA: “Import Transactions” After clicking: Modal closes and transactions appear in main Transactions table. INTEGRATIONS PAGE Design an integrations marketplace page. Show integration cards for: Etsy Ebay Depop Square Venmo Each card should include: logo short description connection status Connect button Clicking “Connect” opens OAuth-style modal flow. Show: external login overlay permissions screen sync confirmation After connection: Display: “Last synced” daily sync status imported transactions count Design should resemble modern SaaS integration pages like Notion or Zapier. SETTINGS PAGE Settings page sections: ACCOUNT logout button change password connected Google account APPEARANCE light mode toggle dark mode toggle accent color selector BRANDING upload logo preview uploaded logo in header DATA export CSV delete account DESIGN DETAILS Use: realistic modern UI components soft glassmorphism sparingly smooth transitions subtle motion design polished onboarding premium SaaS feel Important: This is ONLY a frontend prototype. No backend implementation required. Use mock data everywhere. Generate: all pages all modals all empty states realistic charts responsive desktop layouts dark mode versions The final prototype should feel like a real startup product for artist alley vendors and convention creators. | |||
| Prepare for Testing & Iteration | Evaluation Criteria & Test Plan | Evaluation Criteria | What specific quality benchmarks (e.g., clarity, relevance, tone, accuracy, SEO, hallucination avoidance) will define “good” output? | Confirm that when user uploads photo, it records the right transaction count, amounts, payment types, item names. Count matters as much as accuracy, since a missed row is invisible if you only check what came back. Do not create fake or false rows which were not shown on the sheet. Handle blank values, i.e. when a product category is written down but it's missing the subcategory on the hand-written notes. On the custom report builder, ensure it's building pulling in the correct data and not hallucinating values which artificially increase or decreate the count or prices. | ||
| Example Cases | What specific example use cases, edge cases, and negative cases should be covered by test prompts and outputs? | 1. Uploading the photo 2. Editing the transactions after upload 3. Manually recording a transaction 4. Hard coding/editing values in the table of transactions 5. Requesting custom report via LLM prompt 6. Asking the model to change an existing report 7. Asking the model to delete a report 8. Asking the model to duplicate or merge reports | ||||
| DEVELOP | AI Model Selection & Justification | AI Model Selection & Justification | Which AI model is best suited for your solution and why? What capabilities and limitations does it have? How will it integrate with your product? | I don't need a cutting edge model with high latency and cost per token. This product requires speed, and the use cases are simple enough to leverage an open source model. Privacy isn't a major concern either for small, local artist vendors. With that in mind, I select Anthropic's Opus 4.6 model. | Please leave this area blank. This space is for the Instructor to provide you with feedback. | |
| Define Inputs | Input Specification Table | Required Fields | What are the required input fields for the AI (e.g., title, description, keywords, tone)? Indicate format, source, requirement. | 1. Event name (required) 2. Event date(s) (required) 3. Photo upload from local finder (required) | ||
| Optional Fields | Are there any optional or user-customizable fields? How do they impact the AI’s output? | 4. Edit transaction name, price (optional) | ||||
| Define Good Output | Output Evaluation Checklist | Objective Criteria | What criteria will you use to judge output as “good”? (e.g., structure, use of keywords, tone, factuality, relevance) | Accuracy (provide examples to the model of scanning a hand-written image and outputting rows on a table for each transaction). Transaction name and price must be accurate. | ||
| Subjective Criteria | Are there any criteria that require human judgment or qualitative assessment? | For the user, they should be able to edit each transaction prior to loading it into their transactions table. This is a subjective user input. | ||||
| Prompt Design Iteration | Master Prompt [Final Design] | Prompt Version 1 | What is your starting system prompt for the model? What variations will you test? What techniques will you use to optimize performance? List initial instructions, persona, inputs, and constraints. | Core Instructions: Boothy is a web application for independent artists and creators who sell products at local art events and online marketplaces, where they can track their a) sales across in-person art events, b) online channels like Depop, Etsy, or Ebay, or c) transactions made through payments platforms like Square or Shopify. For (a), the user can either i) upload photos of many handwritten, manually recorded transactions from an in-person art market or ii) manually record individual transactions. For (b) and (c), this is accomplished by integrating directly with those platforms via API. All of these transactions are recorded in a table which is structured like a relational database and visualized as charts on a dashboard. This is all accessible via a web browser, which the user must create an account and login/authenticate into. User Persona: You are an executive assistant for these independent artists and creators. If they want to upload transactions, edit transactions, delete transactions, or create new custom reports on their dashboard, you are here to help and serve. You should be playful, girly, witty, and fun. No corporate jargon or hard-to-understand data terms. Keep it simple. Inputs: The following should be visualized as a modal on top of the “Transactions” page when the user clicks a CTA to “Add event sales”. When a user uploads an image of manually recorded transactions from an in-person art market, they will enter: - Event name (required) - Event date(s) (required) - can be one day or multiple continuous dates, and this is visualized for the user as a calendar - Upload one or many images from their local finder/device storage. Accept PNG, JPG, JPEG, PDF, SVG (required) When the user completes the 3 steps above, display all transactions as rows on a table within the modal where the table has the following columns: - Event name - Event date(s) - Product category - Product subcategory - Price The user can click into and edit any of these values. Once done, they can click “Submit”. The modal closes, and the user sees a table on the “Transactions” page with ALL transactions the user has ever recorded or were ever pulled in via API integrations with 3rd party online sales or payments platforms. These rows are similarly editable as well. This table feeds the charts on the “Dashboard” tab of the application. Additionally, on the “Dashboard” tab, there is a text box at the top of the page which allows the user to ask for custom reports to get built. Example query is “Build me a chart with all sales from the Angel Fair market”. Once submitted, a new chart is added to the bottom of the dashboard and the user is auto-scrolled down to see it. Design aesthetic: The design aesthetic should feel: modern but cozy creative and artist-friendly inspired by tools like Linear, Notion, and Stripe dashboards slightly playful with subtle illustrations optimized for desktop first clean whitespace rounded cards soft shadows highly visual data dashboards elegant empty states dark mode support responsive layouts. Global layout: Use a left sidebar navigation with: Dashboard Transactions Products Integrations Settings Top header should include: page title search bar notification bell uploaded user logo/avatar on upper right Use a modern SaaS layout with card-based analytics. Use tasteful pastel accents inspired by convention artist alley aesthetics: lavender muted pink cream soft blue mint Typography should feel premium and modern. Login experience: Create a beautiful login screen. Include: product logo tagline: “Track every art sale — from artist alley to Etsy.” login form email field password field “Continue with Google” SSO button Login CTA Sign Up CTA Background should include subtle illustrations of: stickers keychains shirts prints artist booth setups After login, transition to Dashboard. Dashboard page: This is the home screen after login. If NO transactions exist: Show a polished empty state. The empty state should include: illustration of a fictional sales report fake event named: “My First Art Event” sample bar chart displaying shirt sales Fake SKUs: Moomin Shirt Pochaco Shirt Keroppi Shirt Angel Feire Shirt Hamtaro Shirt Include a text link: “Add art sales here” The link should visually route users to the Transactions page. If transactions DO exist: Show analytics dashboards instead. Include these chart cards: Cumulative Sales — Last 12 Months line chart X axis = month Y axis = revenue Sales by Product Category vertical bar chart categories: shirts prints stickers keychains jewelry Sales by Product Subcategory horizontal bar chart examples: Moomin Pochaco Hamtaro Keroppi Sales by Event stacked bar chart event names on X axis KPI cards at top: Total Revenue Top Selling Product Best Event Average Order Value Use highly polished data visualizations similar to Stripe or Framer analytics dashboards. Transactions page: This page behaves like a lightweight relational database. At the top left: Two primary CTA buttons: New Event New One-Off Sales Below: A large editable data table. Columns: Date(s) Event Name Product Category Product Subcategory Price Payment Method Payment methods include: Cash Venmo Square Paypal Each row represents ONE individual item sold. Use realistic fake rows from anime convention artist alleys. Example rows: 05/14/2026 | Kawaii Expo | Shirts | Pochaco | $32 | Venmo 05/14/2026 | Kawaii Expo | Prints | Moomin | $15 | Cash 05/15/2026 | Sakura Market | Stickers | Keroppi | $8 | Square Table should support: sorting filtering searching inline editing pagination sticky headers NEW EVENT MODAL FLOW When user clicks “New Event”, open a multi-step modal. STEP 1 — EVENT DETAILS Modal should include: Event Name text field Date selector button labeled “Date(s)” When clicked: Open embedded mini calendar overlay inside modal. Support: single date selection multi-day continuous ranges “Continue” button is disabled until: event name entered dates selected STEP 2 — IMAGE UPLOAD Show image uploader UI. Text: “Upload photos of your handwritten sales notes.” Include: drag/drop upload area Upload button Allow: one or multiple images After upload: Show animated processing sequence. Sequence: “Good job!” — 2 seconds “Scanning your sales...” — 3 seconds “Uploading the good stuff...” — 2 seconds “Success!” — 2 seconds Use delightful animated loading illustrations. STEP 3 — OCR REVIEW TABLE Show editable extracted transaction table. Columns: Product Category Product Subcategory Price Populate with fake OCR results extracted from handwritten notes. Example: Shirts | Pochaco | $32 Prints | Moomin | $15 Stickers | Hamtaro | $6 Users can: click cells edit values delete rows add rows Primary CTA: “Import Transactions” After clicking: Modal closes and transactions appear in main Transactions table. Integrations page: Design an integrations marketplace page. Show integration cards for: Etsy Ebay Depop Square Venmo Each card should include: logo short description connection status Connect button Clicking “Connect” opens OAuth-style modal flow. Show: external login overlay permissions screen sync confirmation After connection: Display: “Last synced” daily sync status imported transactions count Design should resemble modern SaaS integration pages like Notion or Zapier. Settings page: Settings page sections: ACCOUNT logout button change password connected Google account APPEARANCE light mode toggle dark mode toggle accent color selector BRANDING upload logo preview uploaded logo in header DATA export CSV delete account DESIGN DETAILS Use: realistic modern UI components soft glassmorphism sparingly smooth transitions subtle motion design polished onboarding premium SaaS feel. | ||
| Prompt Iterations | If revised, what changes did you make and why? How do you track and record prompt evolution? | The system prompt evolved to the following through iteration and in attempting to make it provide more accurate and reliable results for the user: export const BOOTHY_SYSTEM_PROMPT = ` You are Boothy AI, an analytics and strategy assistant for independent artists who sell handmade art goods at local art markets, conventions, artist alleys, pop-ups, and online marketplaces. Your job is to help the artist understand their sales data and make better business decisions. You are embedded inside the Boothy app. The user expects concise, useful, visually readable answers. SOURCE OF TRUTH Use the user's actual Boothy data as the source of truth: - transactions - products - event names - product categories - product subcategories - prices - dates Do not invent numbers. Do not estimate unless you explicitly say it is an estimate. If the data is missing, say what data is missing. STYLE Write in clear plain English. Be concise. Use short sections. Use bullet points when helpful. Do not use markdown tables. Do not use raw JSON. Do not use long paragraphs. Do not over-format with excessive headings. Do not include broken table syntax with pipes. WHEN ANSWERING ANALYTICS QUESTIONS Always include: 1. Direct answer first 2. Supporting numbers 3. Practical interpretation 4. Recommended next action EXAMPLE GOOD ANSWER Your best event was Second Test Event. It generated $82 in revenue from 4 sales. First Test Event generated $79 from 3 sales, so Second Test Event performed slightly better by $3. What this means: - The difference is small, so both events performed similarly. - Second Test Event had a broader product mix, which may have helped. - Pochaco appears to be your strongest recurring product. Recommended next action: Bring more Pochaco inventory to your next event and keep testing a mix of shirts, stickers, and keychains. RULES - Never mention that you are looking at JSON. - Never say "based on the JSON". - Never expose implementation details. - Never use markdown table formatting. - Never use pipe characters to create tables. - Keep answers under 250 words unless the user asks for more detail. ` | ||||
| Data Preparation & RAG Implementation | Data Preparation & RAG Implementation | What data sources will you use? How will you prepare data for model training or evaluation? (e.g., cleaning, structuring). For RAG: How will you chunk, embed, retrieve relevant information? | Ten to fifteen photos with known correct answers — right transaction count, amounts, payment types, item names. Count matters as much as accuracy, since a missed row is invisible if you only check what came back. Visualized correctly on dashboard with existing transactions or no existing transactions to build on top of. Evaluate model success further by users correcting the upload—ie. post-upload, if the user manually edits transactions before saving, then that tells the model it got it wrong. | |||
| Create Evaluation Set | Example Input/Output Data for Testing | Typical Examples | What are the most common inputs and expected outputs? Use real data if possible. | Photo of multiple transactions from a single art event. Example: Pochaco tee, M, $39. Waves print, L, $20. Many records will be difficult to read, scribbled, with varying format. Some rows may simply say Pochaco, others may say poch waves x2. And different users' handwriting will obviously be different as well. So the model must be smart enough and trained on sufficient data to get it close to accurate every time, then learn when corrected (human-in-the-loop) | ||
| Edge Cases & Negative Cases | What examples test the AI’s limits? (e.g., missing data, ambiguous input, out-of-domain) | Missing size, whether it's a tee or sticker or print, missing price. Multiple transactions recorded in one entry (i.e. Pocachaco, Waves, $59). Abbreviations. Difficult to read hand-writing. Products which aren't currently in the product log within the user's account. | ||||
| Test Example Data & Review Results | Manual Review | Run your input data with the prompt. How did your output perform in manual review? Which examples failed which criteria, and why? | The early iterations of the prompt failed when multiple rpoducts were combined into one row, when the products were written as abbreviations or shortened versions of the true product name, and when handwriting was especially messy. It also often got the price of the products wrong when a row had more than one product. For example, if there's two products like Pochaco tee shirts ($30) and Waves art prints ($14) and a handwritten row said "Poch Waves $44" the model had difficulty deciphering it. | |||
| Automated Evaluation | What pass/fail rate or scores did the AI achieve on core criteria? | The model was quite successful to start at 72% average, which we've improved towards 90%. Still room to improve at the time of finishing this brief, but it's making steady progress with human-in-the-loop and other iterations to the system prompt and RAG. | ||||
| Handle Edge Cases & Iterate | Edge Case Identification | What edge cases did you identify in testing or real usage? | Missing size, whether it's a tee or sticker or print, missing price. Multiple transactions recorded in one entry (i.e. Pocachaco, Waves, $59). Abbreviations. Difficult to read hand-writing. Products which aren't currently in the product log within the user's account. | |||
| Updates & Adjustments | What prompt or system adjustments have you made based on failures, feedback, or edge case observations? | I iteratively refined the extraction prompt based on real handwritten sales notes that exposed failure modes. The biggest change was adding explicit rules for bundled transactions (e.g., "Usahana + Radish $47") so the model learns to split combined prices into multiple products rather than assigning the full amount to the first item. I also added confidence scoring, review notes, source-line tracing, and instructions to estimate the number of visible transactions and flag potential missing rows. Finally, I incorporated user correction feedback into future prompts so the model learns from extraction mistakes over time. | ||||
| Automate Evaluation Approach | Evaluation Method | What is your chosen approach for evaluation (human, model grader, script)? How will you scale testing to diverse/large test sets? | My primary evaluation approach is human review because handwritten notes vary significantly across users, writing styles, abbreviations, and event workflows. Users review extracted rows before import, correcting missing products, incorrect prices, and bundled transactions, creating a growing dataset of ground truth examples. To scale testing, I will build a library of handwritten sales-note images representing different handwriting styles, layouts, and edge cases, then measure extraction accuracy against manually verified outputs. Over time, I can supplement this with automated scripts that compare extracted rows against known expected results. | |||
| Evaluation Frequency | How often will you re-run evaluations for new data, new prompts, or post-launch monitoring? | I plan to re-run evaluations whenever I make prompt changes, update extraction logic, or introduce new correction-feedback mechanisms. During development, evaluations will be run after each significant prompt iteration using a fixed benchmark set of handwritten sales notes. After launch, I will monitor user corrections and periodically evaluate extraction performance against newly collected examples to identify emerging failure modes. This creates a continuous improvement loop where production feedback informs future prompt and system updates. | ||||
| DEPLOY | Finalize Launch & Rollout Plan | Operational Readiness Checklist | Technical Readiness | Is infra (APIs, databases, rate limits, monitoring, rollback) tested and documented? | Boothy currently uses Supabase for data storage and Claude APIs for handwriting extraction. Core workflows, API integrations, and database persistence have been tested manually throughout development, but formal load testing and rollback procedures remain future work. Initial monitoring relies on application logs and extraction review workflows to identify failures. As the product matures, I plan to add structured monitoring, rate-limit handling, error dashboards, and deployment rollback documentation. | Please leave this area blank. This space is for the Instructor to provide you with feedback. |
| Organizational Readiness | Have internal teams (support, comms, legal) been trained? Is documentation complete? | Boothy is currently an early-stage project developed as part of an AI product management course, so formal support, communications, and legal teams do not yet exist. Product requirements, workflows, and technical decisions are documented within the project repository and development notes. Future commercialization would require onboarding materials, support documentation, privacy policies, and legal review before launch. | ||||
| Launch & Rollout Strategy | Launch Approach | What is your launch approach? Pilot, AB test, or all users—who gets access and when? | I plan to begin with a small pilot consisting of artists who currently track sales manually at conventions and art markets. This allows testing against real-world handwriting styles and workflows before broader release. Early users will receive access first, provide feedback, and help identify extraction edge cases. Broader availability would follow once accuracy and usability targets are consistently met. | |||
| Scale Readiness | How will you ensure readiness for scale? How will you monitor initial volume and scale up? | Readiness will be measured through successful pilot usage, extraction accuracy, system stability, and user retention. Initial volume will be monitored through API usage, extraction success rates, database growth, and user activity metrics. Supabase and cloud-hosted AI APIs provide a scalable foundation for early growth. Additional monitoring and infrastructure optimization would be introduced as usage increases. | ||||
| Go-to-Market Plan | Marketing / Training Assets | What assets (FAQ, demo, guides) will you prepare for external communication/marketing? | I plan to create a product demo, onboarding guide, FAQ, and tutorial videos demonstrating how artists can convert handwritten sales notes into structured sales analytics. Marketing materials will emphasize time savings, automated reporting, and convention performance insights. Real examples and customer success stories will be incorporated as pilot users begin adopting the platform. | |||
| Stakeholder / Internal Comms | How will you communicate launch plans, progress, and outcomes internally? | Launch plans, milestones, feature updates, and pilot results will be documented within project planning documents and product roadmaps. Progress will be tracked through regular reviews of product metrics, user feedback, and AI extraction performance. Key learnings and improvement opportunities will be summarized after each major testing phase. | ||||
| Confirm Legal, Privacy & Risk Protocols | Data & Privacy | How do you handle and protect user data, including storage, privacy, and compliance? | User data is stored within Supabase using authenticated user accounts and database access controls. Uploaded images and extracted sales records are associated only with the user's account. Personally identifiable information is minimized, and access to user data is restricted through authentication and authorization controls. Future versions will include formal privacy policies and compliance reviews as the product evolves. | |||
| Policy & Compliance | Are content moderation, legal, and audit processes in place? Are you compliant with regulations needed for your domain? | Boothy primarily processes sales records and product information rather than user-generated public content, reducing moderation requirements. The current prototype is intended for educational and pilot purposes rather than regulated financial reporting. Prior to commercialization, privacy, data retention, and compliance requirements would undergo legal review and documentation. | ||||
| Define Success Metrics | Success Metrics | User/Business Metrics | What user metrics will indicate success? What business metrics will demonstrate value? | Key user metrics include successful transaction imports, monthly active users, retention rates, repeat uploads, and time saved compared to manual data entry. Business value will be measured through subscription adoption, customer retention, user growth, and conversion from trial to paid plans. Improvements in sales tracking accuracy and reporting usage will also indicate product value. | ||
| AI Metrics | How will you measure AI performance and accuracy? | AI performance will be measured using extraction accuracy, percentage of correctly identified products, pricing accuracy, bundle-handling accuracy, and row-completeness rates. User corrections provide ground-truth data that can be compared against AI outputs. Confidence scores, review notes, and extraction audits help identify recurring failure modes and opportunities for prompt improvements. | ||||
| Monitor, Iterate & Improve | User Support & Feedback Plan | Support Channels | Where can users get support? Is escalation and ownership clear? | During the pilot phase, support will be provided directly by the product creator through email and feedback channels. All issues will be tracked and prioritized within the product backlog. As the product grows, support ownership, escalation paths, and response-time expectations will be formally documented. | ||
| Feedback Workflow | How do you gather, triage, and act on feedback and bugs? How are critical issues prioritized and communicated? | Feedback is collected through user testing, pilot usage, and review of transaction corrections made during the extraction workflow. Issues are categorized by severity, frequency, and impact on user outcomes. Critical issues affecting data integrity or core functionality receive highest priority and are addressed before new feature development. Lessons learned are incorporated into prompts, workflows, and future releases. | ||||
| Monitoring & Continuous Improvement | Monitoring Approach | What monitoring/logging is in place to spot operational/AI issues post-launch? | Current monitoring includes application logs, API responses, extraction review workflows, and error tracking during development. Extraction confidence scores, missing-row detection, and user correction patterns provide visibility into AI performance issues. Future releases will include structured logging, alerting, and operational dashboards for proactive monitoring. | |||
| Ongoing Improvement | How will you collect learnings, review performance, and update your system continuously post-launch? | Boothy follows a continuous improvement process driven by user feedback, extraction corrections, and performance metrics. Pilot users help identify new handwriting styles, transaction formats, and edge cases that require prompt adjustments. Regular evaluation cycles compare AI outputs against corrected results, allowing prompts, workflows, and system behavior to improve over time. This creates a feedback loop where real-world usage continuously improves product quality and AI accuracy. | ||||